Linfield University - Online and Continuing Education Computer Science Programs
Linfield University - Online and Continuing Education is a private not-for-profit institution situated in McMinnville, Oregon. McMinnville is a good match for students who enjoy small-town life.
Featured schools near , edit
Where Is Linfield University - Online and Continuing Education?
Contact details for Linfield OCE are given below.
| Contact Details | |
|---|---|
| Address: | 900 Se Baker Street, McMinnville, OR 97128-6894 |
| Phone: | 503-883-2447 |
| Website: | www.linfield.edu/dce.html |
| Facebook: | https://www.facebook.com/pages/Linfield-College-Adult-Degree-Program/356325706747 |
| Twitter: | https://twitter.com/linfieldpdx |
How Do I Get Into Linfield OCE?
You can apply to Linfield OCE online at: https://www.linfield.edu/admission/oce-admission/index.html
Can I Afford Linfield University - Online and Continuing Education?
The student loan default rate at Linfield OCE is 2.1%. This is significantly lower than the national default rate of 10.1%, which is a good sign that you'll be able to pay back your student loans.
Linfield University - Online and Continuing Education Undergraduate Student Diversity
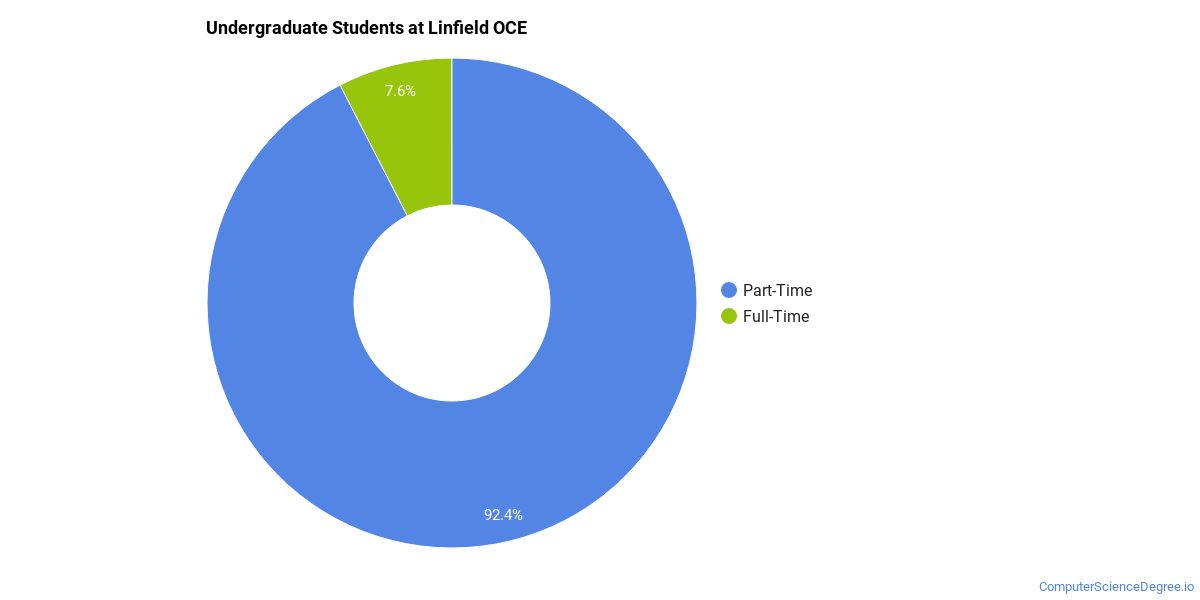
There are also 15 graduate students at the school.
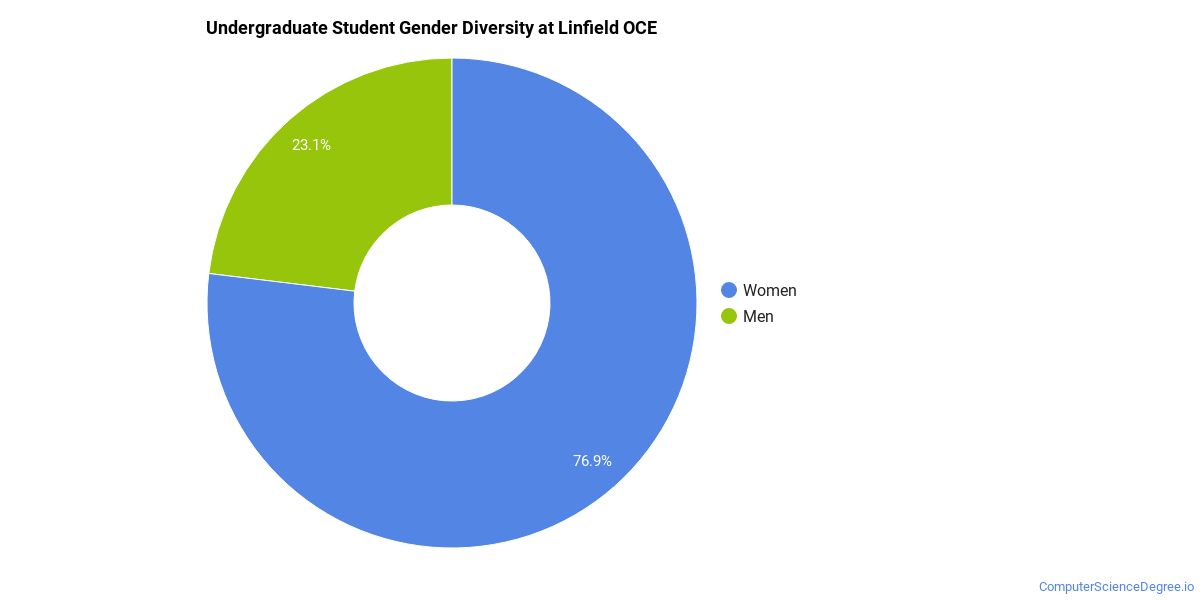
Gender Diversity
Of the 13 full-time undergraduates at Linfield OCE, 23% are male and 77% are female.
Racial-Ethnic Diversity
The racial-ethnic breakdown of Linfield University - Online and Continuing Education students is as follows.
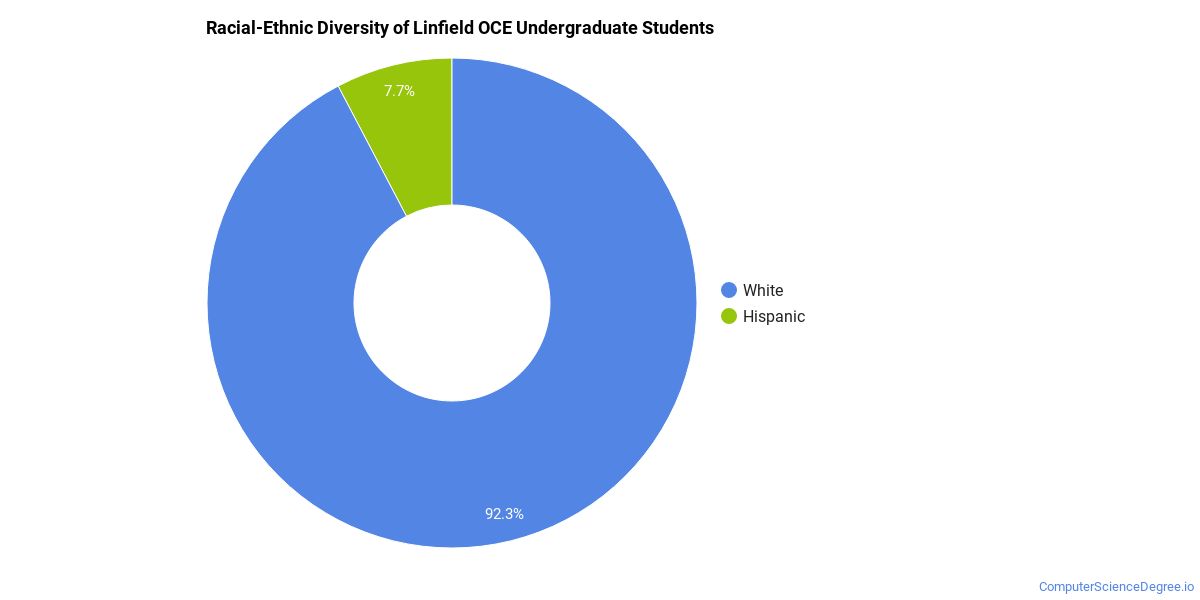
| Race/Ethnicity | Number of Grads |
|---|---|
| Asian | 0 |
| Black or African American | 0 |
| Hispanic or Latino | 1 |
| White | 12 |
| International Students | 0 |
| Other Races/Ethnicities | 0 |
Online Learning at Linfield University - Online and Continuing Education
The following chart shows how the online learning population at Linfield OCE has changed over the last few years.
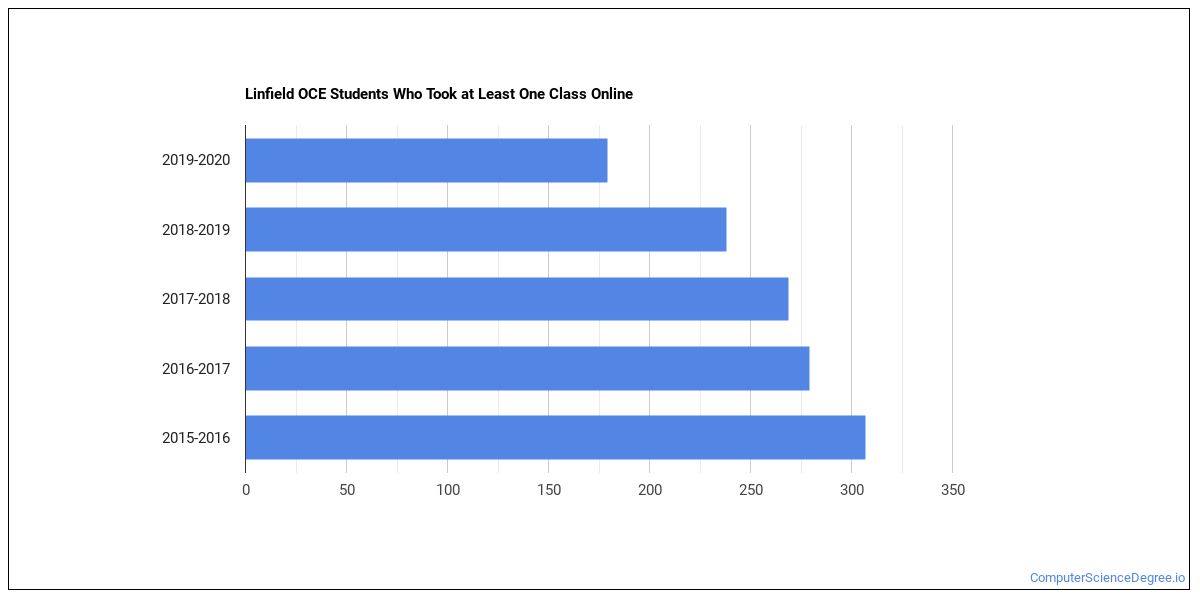
This school is the 6th most popular in Oregon for online learning according to the online graduations recorded by the Department of Education for the academic year 2019-2020.
Online Affordability Rankings of Linfield OCE Rankings
The following table shows how Linfield OCE is ranked for affordability for both in-state and out-of-state students among colleges and universities that are mostly online.
| Major | Tuition for In-State Students | Tuition for Out-of-State Students |
|---|---|---|
| Computer Systems Analysis | #7 | #7 |
| Information Systems | #7 | #7 |
Online Growth Rankings of Linfield OCE
The average growth rate over the last four years of online students at Linfield University - Online and Continuing Education was -12.4%. This is the #670 largest growth rate of all schools that are mostly online. This refers to all students at Linfield OCE regardless of major.
The table below shows how the average growth rate over 4 years at Linfield OCE ranks compared to all other mostly online schools that offer a specific major. Note that the majors may or may not be offered online at Linfield OCE.
| Major | Growth Rate Rank | |
|---|---|---|
| Computer Systems Analysis | #23 | |
| Information Systems | #23 |
When we speak of partially online, we are referring to schools whose online population is less than 50% of its total student body. Mostly online refers to those with online populations greater than or equal to 50%.
Linfield University - Online and Continuing Education Computer Science Concentrations
The table below shows the number of awards for each concentration.
| Major | Bachelor’s | TOTAL |
|---|---|---|
| Information Systems | 2 | 2 |
| Data Modeling/Warehousing & Database Administration | 0 | 0 |
| Web & Multimedia Design | 0 | 0 |
| Computer & IS Security | 0 | 0 |
| TOTAL | 2 | 2 |
References
*The racial-ethnic minorities count is calculated by taking the total number of students and subtracting white students, international students, and students whose race/ethnicity was unknown. This number is then divided by the total number of students at the school to obtain the racial-ethnic minorities percentage.
More about our data sources and methodologies.
Featured Schools
 Request Info
|
Southern New Hampshire University You have goals. Southern New Hampshire University can help you get there. Whether you need a bachelor's degree to get into a career or want a master's degree to move up in your current career, SNHU has an online program for you. Find your degree from over 200 online programs. Learn More > |
ComputerScienceDegree.io provides higher-education, college and university, degree, program, career, salary, and other helpful information to students, faculty, institutions, and other internet audiences. Presented information and data are subject to change. Inclusion on this website does not imply or represent a direct relationship with the company, school, or brand. Information, though believed correct at time of publication, may not be correct, and no warranty is provided. Contact the schools to verify any information before relying on it. Financial aid may be available for those who qualify. The displayed options may include sponsored or recommended results, not necessarily based on your preferences.
© ComputerScienceDegree.io – All Rights Reserved.